« Previous « Start » Next »
124 Van der Pol Oscillator
Restricted second order information for the solution of optimal control problems using control vector parameterization. 2002, Eva Balsa Canto, Julio R. Banga, Antonio A. Alonso Vassilios S. Vassiliadis
Case Study 6.1: van der Pol oscillator
This case study has been studied by several authors, for example Morison, Gritsis, Vassiliadis and Tanartkit and Biegler.
124.1 Problem Description
The dynamic optimization problem is to minimize:
subject to:
Reference: [31]
124.2 Problem setup
toms t
p = tomPhase('p', t, 0, 5, 60);
setPhase(p);

tomStates x1 x2 x3
tomControls u

% Initial guess
x0 = {icollocate({x1 == 0; x2 == 1; x3 == 0})
    collocate(u == -0.01)};

% Box constraints
cbox = {-10  <= icollocate(x1) <= 10
    -10  <= icollocate(x2) <= 10
    -10  <= icollocate(x3) <= 10
    -0.3 <= collocate(u)   <= 1};

% Boundary constraints
cbnd = initial({x1 == 0; x2 == 1; x3 == 0});

% ODEs and path constraints
ceq = collocate({dot(x1) == (1-x2.^2).*x1-x2+u
    dot(x2) == x1; dot(x3) == x1.^2+x2.^2+u.^2});

% Objective
objective = final(x3);
124.3 Solve the problem
options = struct;
options.name = 'Van Der Pol';
solution = ezsolve(objective, {cbox, cbnd, ceq}, x0, options);
t  = subs(collocate(t),solution);
x1 = subs(collocate(x1),solution);
x2 = subs(collocate(x2),solution);
x3 = subs(collocate(x3),solution);
u  = subs(collocate(u),solution);
Problem type appears to be: lpcon
Starting numeric solver
===== * * * =================================================================== * * *
TOMLAB - Tomlab Optimization Inc. Development license  999001. Valid to 2011-02-05
=====================================================================================
Problem: ---  1: Van Der Pol                    f_k       2.867259538084708100
                                       sum(|constr|)      0.000000020744545091
                              f(x_k) + sum(|constr|)      2.867259558829253300
                                              f(x_0)      0.000000000000000000

Solver: snopt.  EXIT=0.  INFORM=1.
SNOPT 7.2-5 NLP code
Optimality conditions satisfied

FuncEv    1 ConstrEv   26 ConJacEv   26 Iter   23 MinorIter  348
CPU time: 0.593750 sec. Elapsed time: 0.594000 sec.
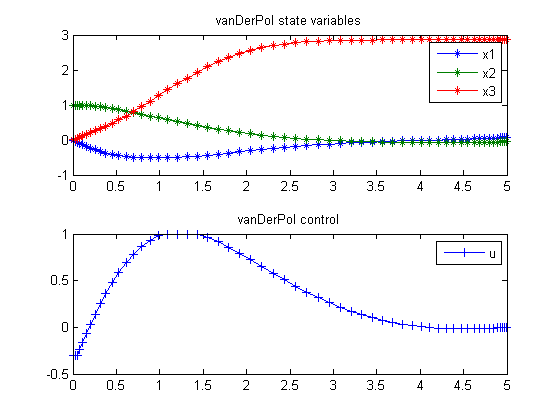
124.4 Plot result
subplot(2,1,1)
plot(t,x1,'*-',t,x2,'*-',t,x3,'*-');
legend('x1','x2','x3');
title('vanDerPol state variables');

subplot(2,1,2)
plot(t,u,'+-');
legend('u');
title('vanDerPol control');
« Previous « Start » Next »